
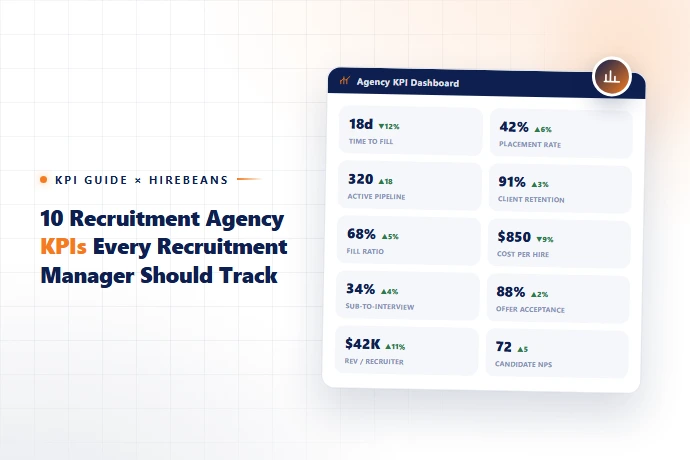
Introduction
1. Open Job Requirements
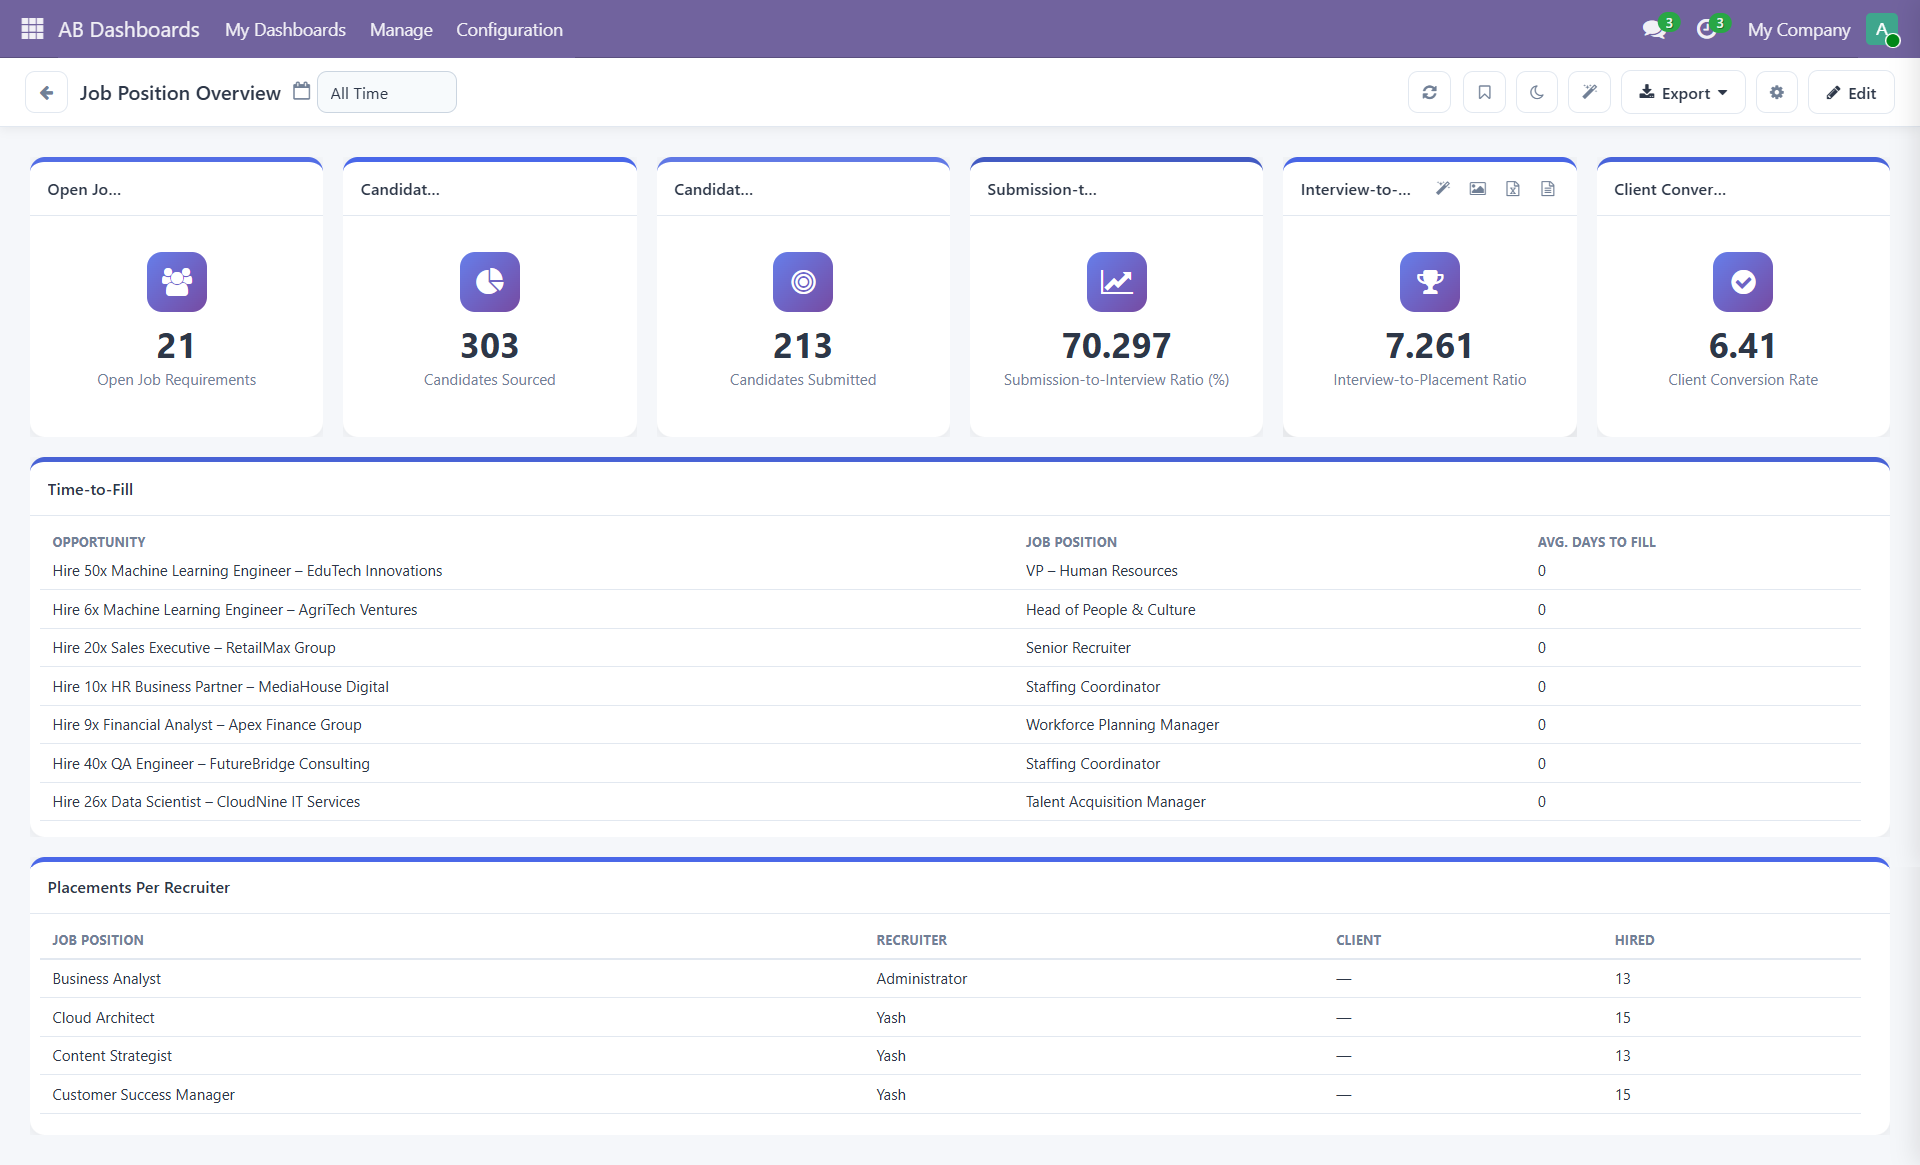
This measures how many active vacancies the agency is currently working on. Tracking open requirements helps managers understand workload and identify vacancies that may need additional attention. See how job requirements and postings flow through the recruitment module in HireBeans.
2. Candidates Sourced
This measures sourcing activity for the agency or individual recruiters. But volume alone doesn't tell the whole story — a recruiter sourcing 100 candidates isn't necessarily performing better than someone sourcing 30 highly relevant candidates. Sourcing quality improves when recruiters work from a clean, deduplicated recruitment agency candidate database rather than scattered spreadsheets.
3. Candidates Submitted
Track how many candidates are actually presented to clients. This provides a clearer picture of pipeline activity than sourcing volume alone and becomes more meaningful when compared with interviews and placements. For a deeper look at getting this right, see how recruitment agencies can track candidate submissions more effectively.
4. Submission-to-Interview Ratio
Formula: Interviews ÷ Submissions × 100
For example, 25 interviews from 100 submissions gives a 25% submission-to-interview ratio. A low ratio may indicate issues with candidate suitability, screening, requirement understanding, or client targeting. Don't use this metric in isolation — look at the context behind the number.
5. Interview-to-Placement Ratio
Formula: Placements ÷ Interviews × 100
This helps managers understand how effectively candidates progress after reaching the interview stage. If interviews are high but placements are low, managers can investigate candidate fit, client expectations, interview preparation, or the quality of the requirements being worked on.
6. Time-to-Fill
- ✓Time-to-fill measures how long it takes to close a recruitment requirement. Long-running vacancies can consume recruiter capacity and may affect the client relationship.
- ✓Track time-to-fill by factors such as:
- ✓Client
- ✓Recruiter
- ✓Job type
- ✓Skill
- ✓Location
- ✓This makes the KPI more useful than relying on one agency-wide average.
7. Placements per Recruiter
This measures successful placements generated by individual recruiters. It can help managers understand productivity and workload, but comparisons should account for the type and difficulty of requirements each recruiter handles. More placements doesn't automatically mean better performance — the quality and commercial value of the work matter too.
8. Client Conversion Rate
- ✓Recruitment agencies also need to measure the business-development side of the operation. A useful funnel might be:
- ✓Lead → Opportunity → Client → Requirement → Placement
- ✓Tracking conversion between these stages can show where business development is working and where potential clients are being lost. This is one area where ATS and CRM data working together becomes particularly useful — see why CRM for recruitment agencies matters for this funnel specifically.
9. Revenue per Client
- ✓Placements tell you how much recruitment activity is happening. Revenue tells you more about the commercial value of that activity. Tracking revenue by client can help managers identify:
- ✓High-value clients
- ✓Growing accounts
- ✓Lower-value accounts
- ✓Repeat business opportunities
- ✓A client generating fewer placements may still be more valuable if those placements produce higher revenue.
10. Revenue per Recruiter
Revenue per recruiter connects individual recruitment activity with business performance. It can be considered alongside requirements handled, candidates submitted, interviews, placements, and average placement value. This gives managers a broader picture than simply counting calls, candidates, or submissions.
The Problem With Tracking KPIs in Excel
- ✓You can calculate almost any recruitment KPI in Excel. The challenge is maintaining the information behind it.
- ✓If candidates are stored in one spreadsheet, client requirements in another, submissions in email, and invoices somewhere else, producing a reliable report becomes a manual exercise. This is one of the clearest signs it's time to outgrow spreadsheets and point solutions.
- ✓A better approach is to have the recruitment workflow naturally generate the data required for reporting:
- ✓Client → Requirement → Candidate → Submission → Interview → Placement → Revenue
- ✓Turn recruitment activity into a clearer management view.
KPIs Should Lead to Decisions
- ✓Low submissions? → Is sourcing the problem?
- ✓High submissions but few interviews? → Are candidates being matched correctly?
- ✓Many interviews but few placements? → Is there a candidate-fit or client-expectation issue?
- ✓Strong placements but low revenue? → Which clients or job categories have the best commercial value?
From Recruitment Data to Recruitment Intelligence
- ✓Your agency already creates valuable information through everyday recruitment activity. The opportunity is to connect that information so managers can move from:
- ✓Data → KPI → Insight → Decision
- ✓rather than:
- ✓Spreadsheet → Manual Report → Outdated Information
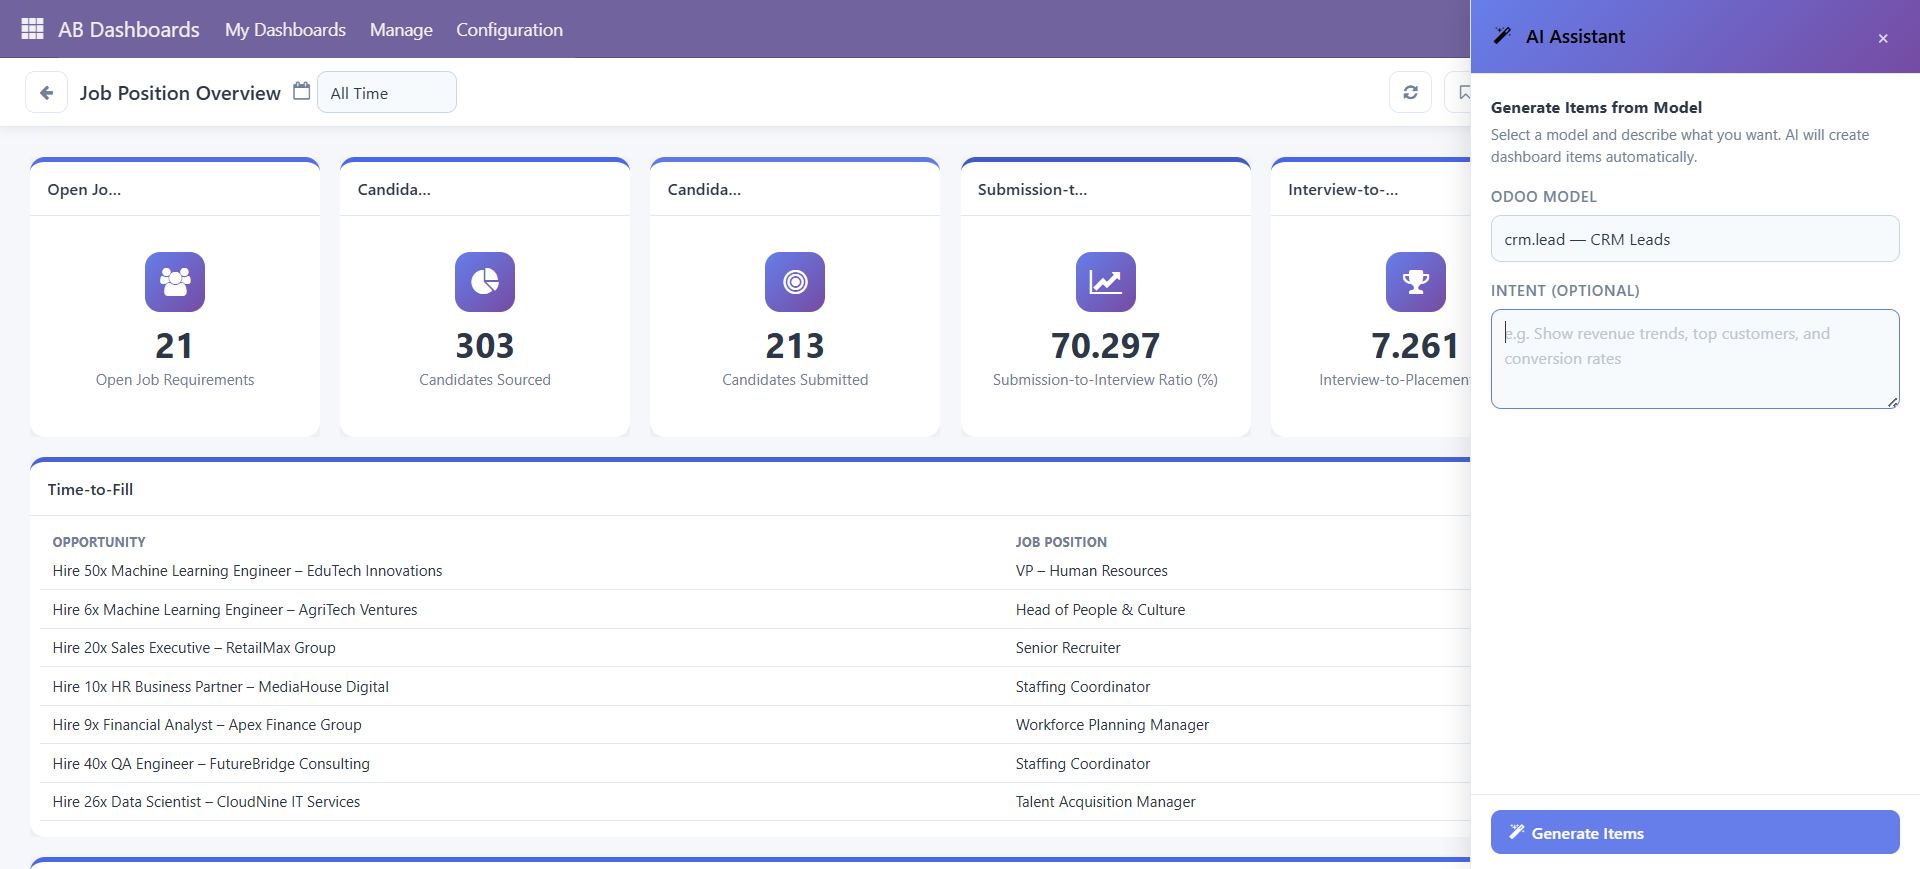
- ✓HireBeans brings recruitment activities and business information together through areas such as recruitment, CRM, dashboards, invoicing, and other agency operations.
- ✓The goal is simple: your recruitment data should help you run your agency — not just report on it.